|
<< Click to Display Table of Contents >> Trend Chart Gridlines |
  
|
|
<< Click to Display Table of Contents >> Trend Chart Gridlines |
|
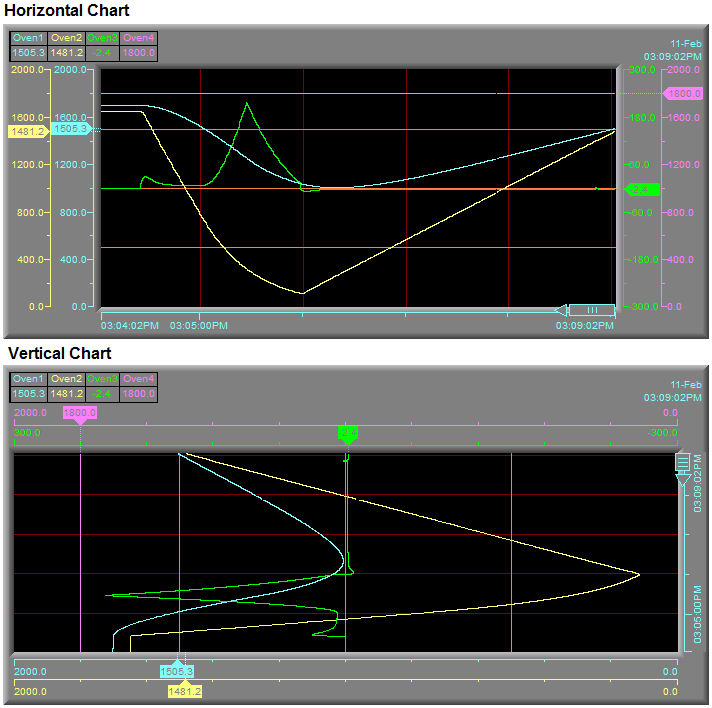
Horizontal and Vertical gridlines on Trend Charts are specified differently depending on whether the chart's orientation is Vertical or Horizontal.
The orientation of a chart is specified on the Chart tab:
Horizontal orientation:
X axis is the time - time gridlines are vertical
Y axis is the value - value gridlines are horizontal
Vertical orientation:
X axis is the value - value gridlines are vertical
Y axis is the time - time gridlines are horizontal
Value gridlines - are defined from the Pens tab by clicking the Edit button for the selected pen to open the Pen Properties box.
Time gridlines - are specified on the Time Axis & Gridlines tab.