|
<< Click to Display Table of Contents >> Trend Chart Properties - Cursors |
  
|
|
<< Click to Display Table of Contents >> Trend Chart Properties - Cursors |
|
Trend Chart cursors are used to display the values of the pen traces at 1 or 2 positions.
When 2 cursors are on the chart then the difference in values is shown.
From Runtime Mode:
Place the cursor by a single right-click on the chart and double-right-click to place the second cursor.
Alternatively use left-click on the chart and choose Place cursor 1 or Place Cursor 2 from the popup menu.
To clear the cursors left-click on the chart and choose Remove cursor(s) from the popup menu.
From Edit Mode (Online):
Right-click on the chart and choose Place cursor 1 or Place cursor 2 from the popup menu.
To clear the cursors right-click on the chart and choose Remove cursor(s) from the popup menu.
Use the cursor keys '->' or '<-' on the keyboard to nudge the selected cursor left or right.
The selected cursor is indicated by a '><' at the top, whereas the cursor with a 'V' at the top is not the selected cursor.
The cursor keys will skip the cursor to the next data point, so it may be necessary to press the cursor keys many times on a dense chart, or it may jump a large distance, when data points are further apart, such as when in Historical Replay.
So the best method of positioning a cursor is to click and place the cursor as close as possible to the required position and then fine-tune with the cursor keys.
To select the other cursor, in order to be able to move it with the cursor keys, it is necessary to 'place' it again, and it will become the selected cursor, indicated by a '><' at the top.
The style, thickness and color of both cursors can be specified from the Cursors tab on the Trend Chart Properties box.
The location on the chart to show the values at the cursors can also be specified, in the following ways:
1. Show in-chart:
The values and differnce between the values are shown in the plotting area:
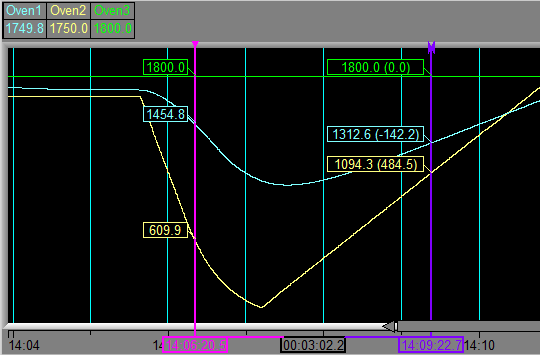
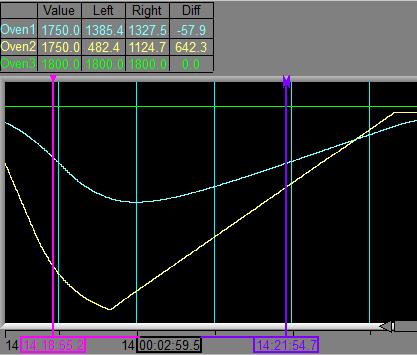
2. Override pen labels:
When only one cursor has been placed then the values shown will be the values at the cursor.
When both cursors have been placed, the values shown will be the difference between the values at the cursors.

3a. Auto expand values area to show cursor values - and when Horizontal is selected on the Values tab.
This shows all the required information at a glance, but reduces the available space for the chart itself:

3b. Or, Auto expand values area to show cursor values - and when Vertical is selected on the Values tab.
This uses screen space more efficiently especially when many other boxes are checked on the Values tab: