|
<< Click to Display Table of Contents >> Trend Chart Properties - Pen Scales |
  
|
|
<< Click to Display Table of Contents >> Trend Chart Properties - Pen Scales |
|
This tab specifies which pens should have scales, and whether they should be on the left or right of the Trend Chart.
Or, in the case of a vertical chart, at the top or the bottom.
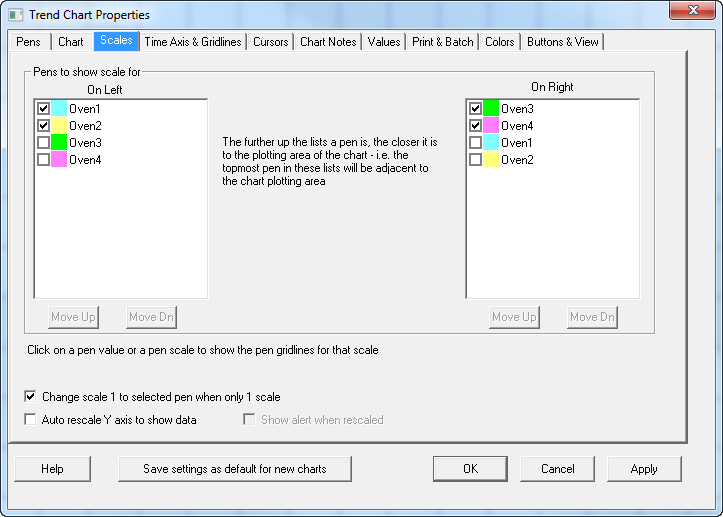
The pens nearest the top of each list will have their scales nearest the plot-area of the chart.
Hence in this example, the scale for Oven1 is nearer to the plot-area than the scale for Oven2.
Change scale 1 to selected pen - this will only take effect while in Runtime Mode (not in Edit mode) and only if there is just one scale. Clicking the pen values will switch the scale to show the scale for the selected pen.
If the trend chart only has one value scale, then to see the scale of any of the other pens, click the pen labels along the top. However, this will only become noticeable if the Pens have different scales and/or colors because the scale and color will change too.
Note: If, for example, there are 4 pens but only 3 scales have been added then it will not be possible to see the scale of the 4th pen. Therefore either have just one scale, or have a scale for each pen.
Auto rescale Y axis to show data - Instead of using the Min and Max specified for the scale, it will automatically adjust to fit the values. Therefore, values will never be outside the range of the scale.