|
<< Click to Display Table of Contents >> Quick Start - Draw a Trend chart |
  
|
|
<< Click to Display Table of Contents >> Quick Start - Draw a Trend chart |
|
Go back to Edit Mode by selecting Edit Mode (either Edit Mode (remain online) or Edit Mode (go offline)) from the File menu.

Click the Draw Trend Chart tool  and the cursor changes to:
 ![]()
Click and drag on the GDW to draw a rectangle. When you release the mouse button a Trend chart is drawn

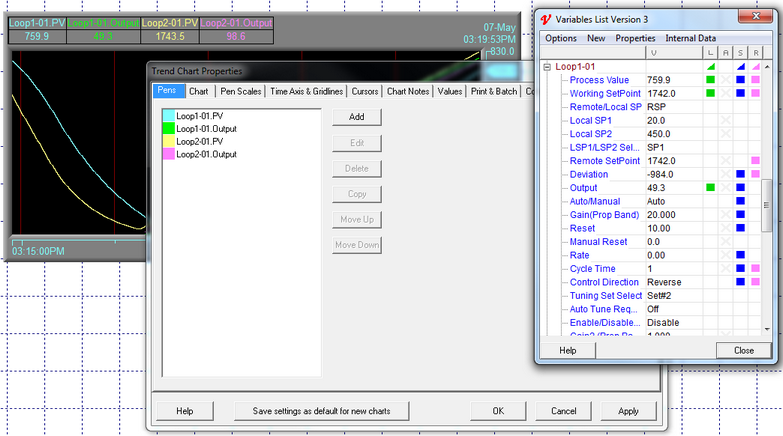
and the Trend Chart Properties box is displayed. Click the Add button to display the Pen Properties and the Variables List boxes:

This is used to choose which parameters are displayed on the Trend chart and the appearance of the chart, colors etc.
From the Variables List expand the list of parameters for the instrument from which you wish to display data by clicking the ![]() symbol if it is not already open.
symbol if it is not already open.
Initially the Pens list (on the Pens tab) is blank, drag parameters from the Variables List either directly into the Pens List, or into the Pens Properties box.
The scales and pen colors will be automatically defined. Other attributes of the pens can be changed using the Pen Properties box.
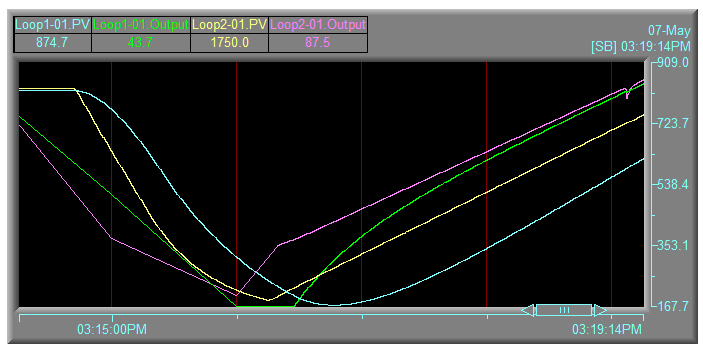
Note: A Pen is the word used to refer to a single trace line on a Trend chart.
The Time Span of the chart can be set on the Chart tab. The Time span can range from 30 seconds to 60 days.
Add some more pens to the chart, then click OK to close the Trend Chart Properties box.
Click the Save tool ![]() to save this GDW again.
to save this GDW again.
To subsequently edit the chart while in Edit Mode, click anywhere on the chart and choose Setup Chart from the popup menu.
More information on setting up Trend Charts
For the next step read: Define a second GDW