|
<< Click to Display Table of Contents >> Trend Chart Menu |
  
|
|
<< Click to Display Table of Contents >> Trend Chart Menu |
|
Clicking on either the frame or plot area of a Trend Chart with the left mouse button. Or if in Edit Mode with the right mouse button will show display the pop up menu:
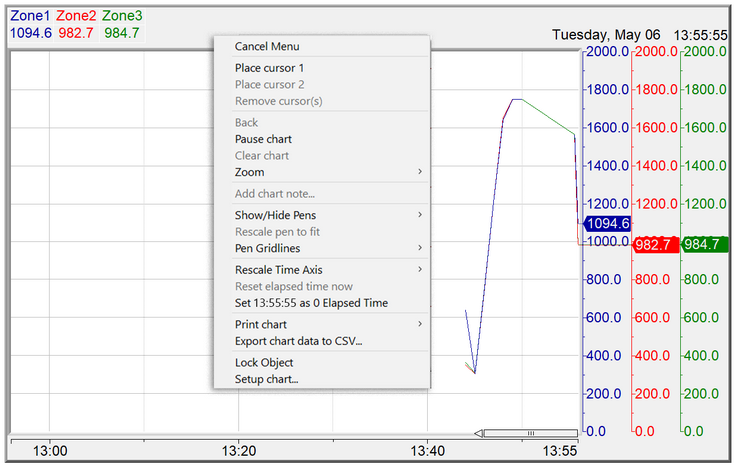
Cancel menu - closes the popup menu, clicking somewhere else on the GDW also closes the popup menu.
Place cursor 1/2 - Cursors are described here.
Pause chart - Temporarily pauses the Trend Chart at the current time.
The Trend Chart will resume by:
| • | Closing and reopening the GDW the Trend Chart is on. |
| • | Opening up the Trend Chart Menu and clicking on Pause chart again. |
Clear chart - Clears the Trend Chart.
Zoom - Enables zooming out of the scales by 20%.
Add chart note - Chart Notes are described here.
Show/Hide Pens - Temporarily hide or show certain pens in real time or in Historical Replay.
The pens will be reset to their native state by:
| • | Closing the GDW the trend chart is on. |
| • | Changing of states of the boolean variable associated with the Enable on boolean pen property. |
For example, if there is a pen called PV on a trend chart. PV can be hidden through the Show/Hide Pens menu by clicking on the pen name (PV) in the Show/Hide Pens menu.
However, if the GDW that has the trend chart on it is closed while the pen PV is being hidden on the trend chart, then the next time the GDW is opened the pen PV will reappear on the trend chart.
Also, the Enable on boolean pen property takes precedence over the Show/Hide Pens menu.
For example, if there is a pen such as PV being hidden or shown on a trend chart through the Show/Hide Pens menu.
If the boolean associated with the Enable on boolean pen property for the pen has changed states from 'Off' to 'On' or vice versa, then the pen PV will be shown or hidden on the trend chart based on the boolean state irrespective of the selections made in the Show/Hide Pens menu.
Showing or hiding a pen in real time has no effect on the pen appearing on a Trend Chart while in Historical Replay.
Also, showing or hiding a pen while in Historical Replay has no effect on the pen appearing on a Trend Chart in real time.
Additionally, the Show/Hide Pens menu is accessible by clicking on the pen values visible on the top left corner of the Trend Chart frame.
There is a video on SpecView's YouTube channel that illustrates the Show/Hide Menu functionality here: 4120 Trend Chart Pen Enable and Disable details.
Rescale pen 'XXXX' to fit - Adjusts the scale automatically to fit the pen's values. Therefore, the values of the pen will never be outside the range of the scale.
Pen Gridlines - Can remove pen gridlines or show all the pen gridlines.
Rescale Time Axis - Temporarily rescale the time axis.
The time scale will reset to its native duration by closing the GDW the Trend Chart is on.
To permanently rescale the time axis, change the duration in Trend Chart Properties > Chart.
Rescaling the time axis temporarily in real time has no effect on the time axis duration in Historical Replay.
Also, rescaling the time axis temporarily while in Historical Replay has no effect on the duration of the time axis in real time.
Reset elapsed time now - Sets the current time as 00:00:00 in the Elapsed Time X Axis.
Set 'XX:XX:XX' as 0 Elapsed Time - Sets 'XX:XX:XX' as 00:00:00 in the Elapsed Time X Axis.
XX:XX:XX is defined by the area on the Trend Chart where the mouse click was registered to open the Trend Chart Menu.
For example, while in Runtime Mode, there is a left click on the Trend Chart to open up the Trend Chart Menu.
The area where the left click occurred is aligned on time axis to 14:20:23.
'XX:XX:XX' will be defined as 14:20:23.
Print chart - The Print chart sub-menu is described here.
Export chart data to CSV - this is the same as Export Range to CSV but includes all the data visible on the chart (not including scroll-back data). There is additional information on the CSV file produced here.
Setup chart - opens the Trend Chart Properties box.