|
<< Click to Display Table of Contents >> Trend Chart Properties - Values |
  
|
|
<< Click to Display Table of Contents >> Trend Chart Properties - Values |
|
This tab of the Trend Chart Properties box controls what is shown in the 'Values' area of the chart.
The 'Values' area is along the top of the chart, which by default contains the Current value and Label for each pen.
Additionally it is possible to show other information:

Horizontal - the information for each pen is shown as a horizontal table - with the pens going across, which uses screen space more efficiently when there are many pens:
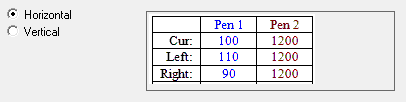
Vertical - the information for each pen is shown as a vertical table - with pens going down, which uses screen space more efficiently when many of the other other boxes are checked on this tab.

The information about cursors can also be influenced by what is checked on the Cursors tab.
The Values Area Color is usually kept the same as the Chart Surround color on the Chart tab.