|
<< Click to Display Table of Contents >> Automatic Chart Notes |
  
|
|
<< Click to Display Table of Contents >> Automatic Chart Notes |
|
Chart notes can be added automatically to the chart based on events in the process, without relying on manual intervention.

Click the Add button under Automatic Chart Notes.
A boolean variable can be assigned, and the chart note text specified for the annotation when that boolean variable changes.
Note: It is advisable to keep the text for chart notes concise.
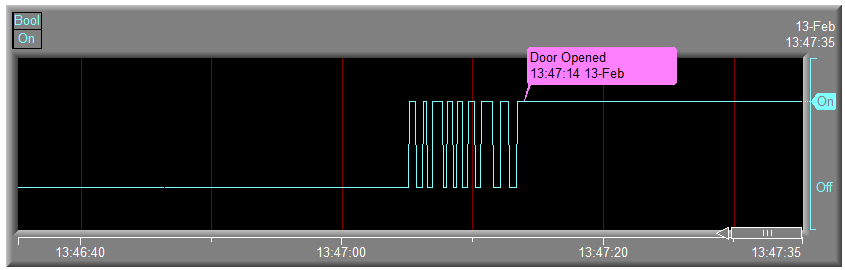
Automatic chart notes can be used, for example, to mark when doors are opened on furnaces and to mark batch endings.
A chart note can be triggered when a boolean is On and/or Off by using Trigger on True, Trigger on False or Trigger on both.
If a chart note is associated with a pen, the chart note will appear on the pen trace.
Note: If the pen associated with a chart note is on multiple charts then the chart note will automatically be added to all charts with that pen.
If the chart note is not associated with a pen (Pen Association is None), the chart note will appear along the edge.
Note: If there are multiple charts then the chart note will automatically be added to ALL charts containing one or more of the pens on this chart.
Optionally, the time between selected notes can be added to the annotation:
If using Trigger on True or Trigger on False then checking Add time since note adds the elapsed time since the last time the specified automatic chart note was created. This can be specified as <This One> meaning this automatic chart note.
This is useful where an auto-note is signaling the end end of a batch, in this case, the duration is automatically calculated.
If using Trigger on both then checking Add time in '1' state adds the duration that it was in the 1 state.
This is useful where an automatic chart note is, for example, marking the end of a batch. The duration of the batch is automatically calculated.
The On Delay and Off Delay are useful when a value fluctuates causing a boolean to flicker on and off before stabilizing.
For example, a boolean indicating whether the Process Value has reached a Setpoint could flicker as the process value approaches the Setpoint.
This delay will mean that the position of the chart note will be at the beginning of the first time it stays On for this delay:
Without the On Delay and Off Delay the automatic chart note would keep recurring during the stabilization period of the value.
The color of the chart note should be set to a color that contrasts with the chart background color.
There is no limit to the number of automatic chart notes that can be defined on a chart.
As of SpecView Build 3.1.249, it is possible to edit the the Scan Rates of the Boolean parameters associated with the Automatic Chart Notes.
To do this, open the Settings.INI folder in the Project Folder.
Under the Trends section, enter the following, AutoChartNoteScanRateHi=X and AutoChartNoteScanRateMed=Y.
Where X and Y by default are 10 and 20 respectively.
Booleans are scanned at the high rate and all other parameters are scanned at the medium rate.
So, by default Booleans are scanned once every second and other parameters are scanned once every two seconds.
To increase the scan rate, decrease the value of X and Y.
To decrease the scan rate or to slow things down, increase the values of X and Y.
