|
<< Click to Display Table of Contents >> Auto Instrument Detection |
  
|
|
<< Click to Display Table of Contents >> Auto Instrument Detection |
|
What does 'Automatic Instrument Detection' mean?
Many instruments have an instrument identity code that SpecView requests. When the instrument responds SpecView uses its built in database to create an Instrument View (or faceplate representation) with button(s) that gives access to all the parameters on that instrument.
Some instruments, such as multi-loop controllers, have a very large number of parameters, in that case the parameters are split into parts, for example into the 'programmer' and the 'loops' (or 'channels'). So one controller can have many Instrument Views within SpecView.
Note that Auto Instrument Detection is inappropriate in the following cases:
- If there is a type of instrument connected that cannot be auto detected, for example, Red Lion, Dupline and Omron
In this case please read Manually Defining Instruments
- If there are additional instrument(s) connected which need to be added to an existing Project
In this case please read Test Comms for Update
For Auto Instrument Detection click the Test Comms for New Project button, to detect the instruments automatically.
The Input Required box is displayed.
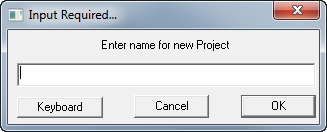
Enter a name for the project. SpecView will create a sub-folder with this name in the SpecView folder (which is normally C:\SV3), the name should follow the Windows file naming rules and should not be too long.
Remember this name. This sub-folder will be where all the log files and project files will be stored. Log Reports will also be stored here unless another folder is specified for the report.
When the name for the project has been entered, click OK, the Ports and Protocols box will be displayed.

Baud Rate
If the baud rate is known then set it appropriately.
If it is left as 'Auto' SpecView will first test different baud rates (9600 baud, then 19,200 baud etc.) for each address for the selected protocol.
If there is any uncertainty as to the baud rate used by the instrument then leave it set to the default shown.
Either select the protocol required for the COM port or use TCP/IP Auto Detection which is available for some types of instrument.
Auto Build GDW View (checkbox)
When this box is checked an Instrument View is created automatically for each instrument found.
Do NOT use this feature if:
- There are more instruments connected than can fit on one screen
- There is an intention to rename the instruments in the project
Instead:
- Let SpecView detect the instruments
- After scanning all ports click Stop which will go into Edit Mode
- Open the Variables List tool![]()
- Rename each instrument if necessary and add Instrument Views to the GDW(s) as required
Once the above has been set then click  to automatically detect instruments.
If the Prompt For Instrument Name As Found box is checked then this box will be displayed:

This allows instruments to be given names as they are detected and the number of decimal places for the parameters of that instrument defined. The instruments can also be assigned to groups, for example, a number of controllers may make up a furnace, so grouping them together under the furnace name makes a logical group.
Once there is an Instrument View (or faceplate representation) displayed on the GDW for each of the instruments which are connected, the screen may look as follows and here are some examples:

Then stop the automatic scanning by clicking the ![]() button. Or if there are instruments on other COM ports then click the Skip to Next Port button to continue scanning on the next COM port.
button. Or if there are instruments on other COM ports then click the Skip to Next Port button to continue scanning on the next COM port.
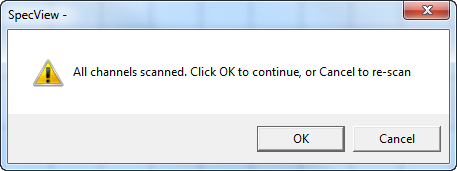
To scan for additional instruments of different types that are connected click Cancel to re-scan:
There is also auto detection for TCP/IP
If there are any problems then first check the wiring and instrument setup
Once the instruments are detected then the next stage is to setup the screen(s) with Trend Charts, Bar charts, Buttons, Bitmaps and other graphics.