|
<< Click to Display Table of Contents >> Quick Start - Automatically detect instruments and display Instrument Views |
  
|
|
<< Click to Display Table of Contents >> Quick Start - Automatically detect instruments and display Instrument Views |
|
Click the 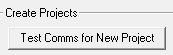 button, to detect the connected instruments automatically.
The Input Required box is displayed:
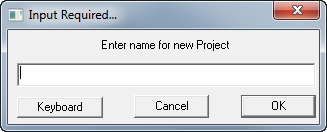
Enter an appropriate name for the project. SpecView will create a sub-folder with this name in the SpecView folder (which is normally C:\SV3), the name you enter should follow the Windows file naming rules and should not be too long.
Remember this name. This folder will be where all the log files and project files will be stored. Log Reports will also be stored here unless another folder is specified.
When a name has been entered for the project, click OK, then the Ports and Protocols box is displayed:

Ports and Protocol
You will need to know which COM port(s) on your computer the instrument(s) are connected to and the type(s) of the instrument(s). If in doubt about this please consult your instrument manufacturer's manual.
For the appropriate COM port(s) select the type(s) of the instrument(s) under Protocol. When you select a protocol for a COM port, a Help button is displayed on the same line. Click it for help on the driver selected.
If the default port settings do not match the settings for your instruments, click ![]() to set up the port.
to set up the port.
BAUD Rate
If there is any uncertainty as to the BAUD rate used by the instrument then leave it set to 'Auto' to allow SpecView to try a range of BAUD rates. If the BAUD rate is known then set it appropriately.
TCP/IP
There is also TCP/IP Auto Detection available for some instrument types.
Start Scan
Click  SpecView will begin to scan the ports and determine what instrument(s) you have connected. As each instrument is found this box is displayed:

This allows the name for each instrument to be assigned (or use the default names), specify the decimal places and if required assign to a group.
Instrument Views (which are typically pictures of the front panel of the instruments) will be displayed on the Graphical Display Window (GDW) behind the Ports and Protocols box. When all your instruments have been auto-detected for this port, if there are further instruments connected to other COM ports then click Skip to Next Port, otherwise if there are no further instruments click Stop. A window will be displayed to say that all channels have been scanned:
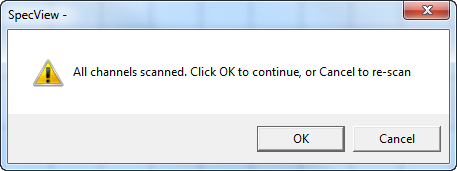
Click OK to continue and enter Edit Mode.
The Edit Mode screen will look something like that shown below.
However, if no Instrument View(s) appear then SpecView is not communicating with the instrument(s). Check your connections and settings and rescan. If problems persist first read Troubleshooting then if unresolved contact your instrument supplier.
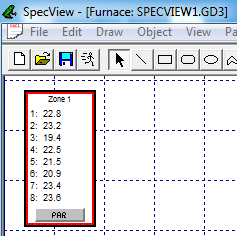
You have now created a GDW containing Instrument Views.
The actual Instrument View displayed will depend on the instrument type, other examples of Instrument Views are shown below:
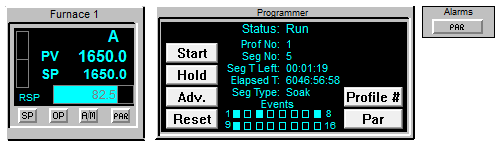
Instrument Views can be repositioned on the GDW by clicking and dragging.
Click the Save tool ![]() and then the Save button to save this GDW as SPECVIEW1.GD3 in the project sub-folder.
and then the Save button to save this GDW as SPECVIEW1.GD3 in the project sub-folder.
For the next step read: Add a variable to the GDW