|
<< Click to Display Table of Contents >> Pre-Plot |
  
|
|
<< Click to Display Table of Contents >> Pre-Plot |
|
As of SpecView 3.1.267, users can now utilize Pre-Plot to analyze and validate batch profiles before running them.

| 1. | Read SpecView’s help on Bar Charts. |
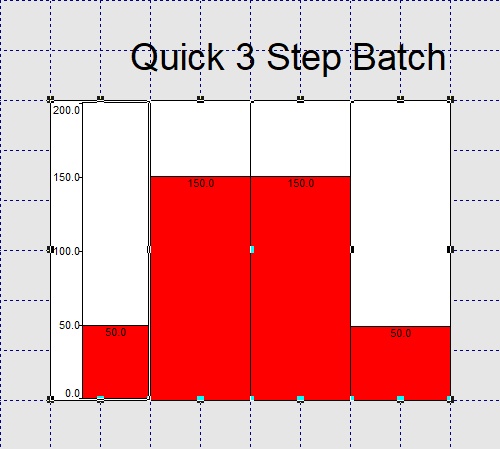
| 2. | Create a Bar Chart for every step of the batch or profile and have the Bar Charts reflect the appropriate Target Set Points. |
The Color of the graph lines used when Bar Charts are linked is set from the "Color when up" option of Bar Chart Setup.
Users can quickly copy over certain Bar Chart attributes to new Bar Charts. Read more here.
The Line Thickness of the line drawn can be changed by selecting one or more of the Bar Charts, then using Object menu -> Line Thickness to set the thickness.
This also changes the thickness of the frame around the Bar Chart.
To remove the exterior frame from the Bar Charts, check the "No frame" option when creating the Bar Charts.
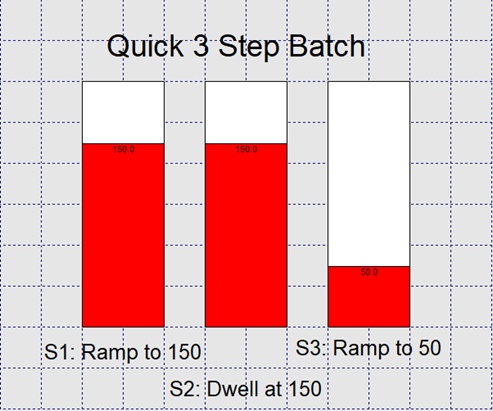
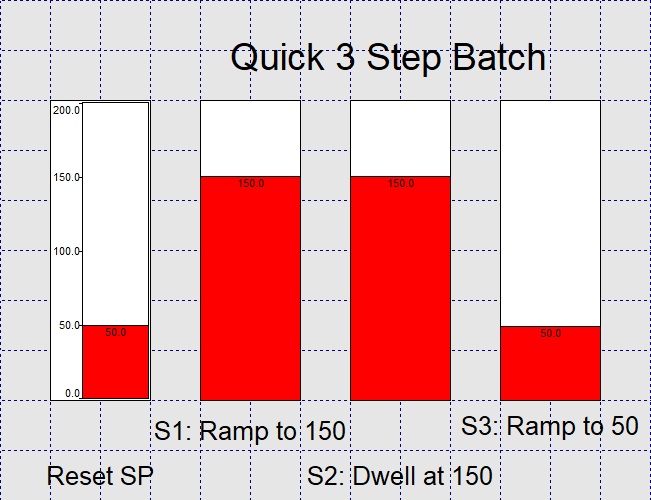
| 3. | Create an additional Bar Chart to the left of the existing Bar Charts in Step 2. |
This Bar Chart signifies the starting point of the Pre-Plot.
Additionally, it could be beneficial to display Scale on the left side of this Bar Chart.
| 4. | Ensure the Bar Charts are next to each other with no gap in between them. |
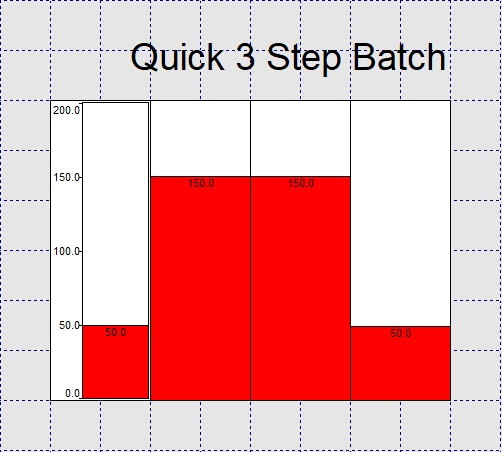
| 5. | Select the Bar Charts. |
| 6. | Click on "Link Charts" from Edit > Linked Bar Charts. |

| 7. | Save the project and enter Edit Mode (Offline). |
| 8. | Enter Runtime. |
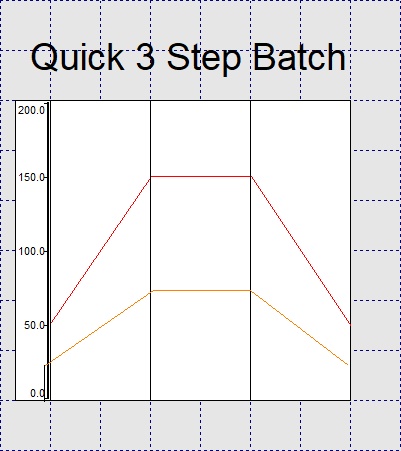
| 9. | The Bar Charts, except for the furthest left Bar Chart, should now be displayed as a continuous line graph that plots out what the profile or batch to be run should look like. |

| 10. | Back in Edit Mode, shrink the Bar Chart on the far left so that only the scale is visible or so that the Bar Chart disappears. |
To make any changes to the variables used to drive the Bar Charts, unlink the Bar Charts.
Follow the steps below to unlink the charts.
| 1. | Select the linked Bar Charts. |

| 2. | Click on "Unlink Charts" in Edit > Linked Bar Charts. |
To make changes to colors and Line Thicknesses, do those changes to the left-most Bar Chart.
Then select all the Bar Charts and choose Edit > Linked Bar Charts > Copy Left Chart Attributes to All.

Additionally, if users are measuring more than one process variable, Pre-Plot can display more than one value by overlaying graphs on top of each other where the graphs are set to transparent.
The image below displays the outcome.
Users will need to follow steps 1-10 mentioned above, and make the second and subsequent Pre-Plot Bar Charts transparent to overlay them on the existing Pre-Plot.
To make the Bar Charts transparent, check the "Transparent" option in Bar Chart Setup.
It is possible to add the Pre-Plot to Recipe.
So, when selecting a new Recipe, the Pre-Plot will automatically change to display the new values.
Users can add the Bar Charts of Pre-Plot to Recipe the same as adding any other object in SpecView to Recipe.
For more information, please read through Recipes.
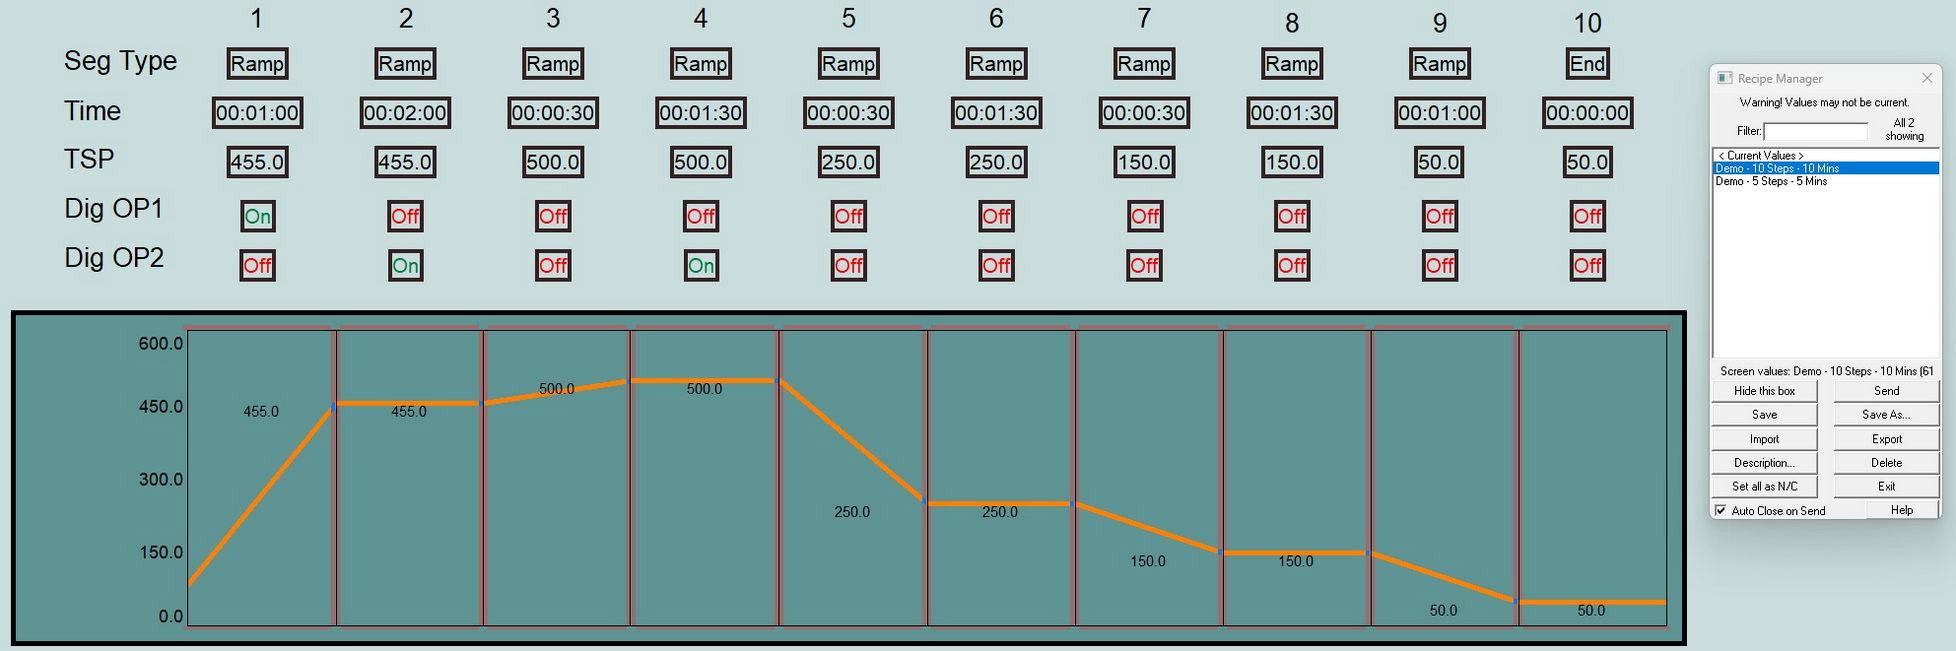
For example, the images below from the Batch Demo display how Pre-Plot will change based on the Recipe selected.