|
<< Click to Display Table of Contents >> Color Dynamics |
  
|
|
<< Click to Display Table of Contents >> Color Dynamics |
|
This box allows the color of objects to change based on values, these objects include:
| • | Value of a variable |
| • | Button, buttons can also be 'disabled'. |
| • | Graphical drawing object |
| • | Grouped object |
| • | Trend Charts, there are additional points to note regarding flashing and hiding of charts. |
| • | Bar Charts |
These objects can also be made to hide or flash.

![]() When this box is checked the outline color of the object will change to the selected color. Unchecked the outline color will stay the same.
When this box is checked the outline color of the object will change to the selected color. Unchecked the outline color will stay the same.
Up to four color changes per variable can be specified so that with the default fill color a total of five colors are available.
NOTE: A different variable and test can be selected for each level. The last one defined will have priority over the others
If the update rate of the Color Dynamics appears to be slow, then ensure that the actual value of a variable is on an open screen. This will ensure that the value, and hence the Color Dynamic, is regularly updated.
It is also a good idea to ensure that the items on the screen which have Color Dynamics are not Grouped together with other items.
Be aware that if editing an object that has Color Dynamics whilst in 'Edit Mode (Online)' where the Color Dynamics has changed its color then clicking OK on your changes will save that color.
If a number of objects are selected which currently all have the same Color Dynamics, and then another variable is dropped into the Color Dynamics setup box then a message is displayed that allows
the new variable to replace the existing variable throughout:

If the button clicked is either 'Yes' or 'No' then it is stored in the [Settings] section of SETTINGS.INI
ColorDynamicsSameReplace=Yes
To reset it exit SpecView and delete this line.
It is possible to use Color Dynamics to cause objects to flash or to be hidden. Buttons can also be disabled using this.
This is done using the drop-down on the right of the Color Dynamics setup box that has 4 choices: No Effects, Hide, Flash Rate 1 and Flash Rate 2.
'Hide' is done by making the object (and the outline of the object) the same color as the background. Hence it is not possible to choose the color when 'Hide' is selected.

The flashing rates (Rate1 and Rate2) are specified on File->Preferences - Display:
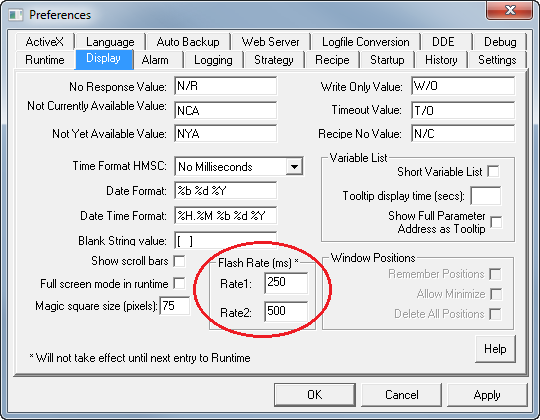
By default Rate1 is 250ms and Rate2 is 500ms - but Rate2 doesn't necessarily have to be greater than Rate1.
To make 2 objects flash alternately like railway crossing lights set Rate1 to 500 and Rate2 to -500.
Then set one of the objects to flash at Rate1 and the other to Rate2 and they will flash alternately.
It is not recommended to use flashing rates of less than 250ms (a quarter of a second) as this will significantly slow the system.
It is possible (but not recommended) to use rates as fast as 100ms (a tenth of a second), but rates faster than 100ms will be forced back to 100ms.
Flashing and Disabling buttons:
Buttons can be made to change color or flash as described above, in addition they can be disabled (not clickable) using Color Dynamics.
When disabling buttons a color change still needs to be specified so that when the test succeeds, the color of the button is changed to that specified and the button is then disabled.
However, if SETTINGS.INI [Settings] HideButtonToBackground=Y is specified then the color is overridden to the color of the screen background. 'N' is the default - meaning that the color specified in the color dynamic is the color used.
Flashing and Hiding Trend Charts:
Trend Charts can be made to hide or flash like any other object on a GDW.
Be aware that making Trend Charts flash, especially if multiple charts are flashing, may affect performance as it is CPU intensive.
Also, making a trend chart flash at the same rate as a pen line is set to blink would mean that the pen line would not be visible.
However, Position Dynamics cannot be used to move Trend Charts. But using Color Dynamics to hide a chart can be used instead to make a chart seem to have been moved.
For flashing the Outline and Fill checkboxes are used to specify the color:
Outline - is the outer edge of the Trend Chart.
Fill - is the surround of the Trend Chart.
For hiding, because the color is irrelevant, the Outline and Fill and checkboxes are ignored.